Chapter 2: Simulation and Debugging Functions |

|

|
|
Chapter 2: Simulation and Debugging Functions |
|
|
Chapter 2: Simulation and Debugging Functions |
|
|
|
Chapter 2: Simulation and Debugging Functions |
|
|
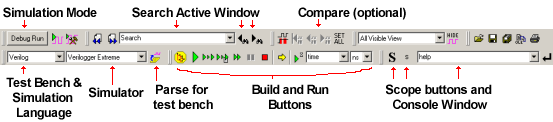
The Simulation Button Bar controls when and how simulations are performed. The interactive command console window can be used to enter simulator commands to observe and control variables and models during simulation. The Search Active Window box will search diagrams for signals, or the project window for anything.
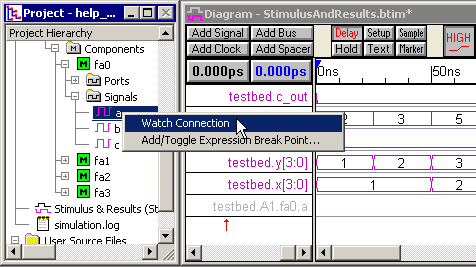
The Stimulus and Results diagram shows the simulated waveforms. Additional signals can be added by right clicking on the signal or component in the Project window and setting a watch on the object and then re-simulating (or continue simulating).
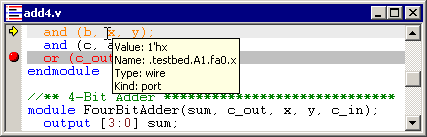
Quickly inspect a variables current value by placing the mouse over a variable in the Edit window. Or use the Simulate > Inspect values menu to investigate variables values at different times during the simulation. Breakpoints can be added to the source code by placing red dots in the grey bar to the left of the code. The current simulation line is indicated by the yellow arrow.
The Report window manages several tab windows are important to simulation and debugging. The simulation.log file displays the default log file for the simulator. The Breakpoints tab displays all of the breakpoints that are set on the code in the editor windows and the components in the project file. And the Errors tab displays any compile or simulation bugs that are found in the design.
