2.5 Inspect And Edit Values |

|

|
|
2.5 Inspect And Edit Values |
|
|
2.5 Inspect And Edit Values |
|
|
|
2.5 Inspect And Edit Values |
|
|
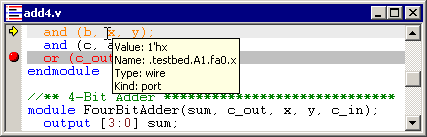
During a paused simulation, BugHunter supports inspecting values of variables and signals in both the Editor windows and in the Inspect Values dialog. The Editor window displays only the current values for the simulation. The Inspect Values dialog can be used to inspect both the current and past values.
Use the Editor window to inspect current values:
•Put the mouse over a variable or signal name. This will cause a tool tips to pop-up and display the value and the type of the variable. |
Use Inspect Values dialog to inspect at previous simulation times:
•Choose Simulate > Inspect Values menu option to open the dialog. |

•Drag and Drop signals from the Stimulus and Results diagram into the Signal Name box. •You may also type variable names into the Signal Name boxes. However, only variables that are also displayed in the Stimulus and Results diagram will be able to view previous values. In order to speed simulation times, the tool only remembers the current values for all of the variables and the diagram stores the previous values for just the signals that are specified as important. |
|
•The Event section changes the value display to different simulation times. As you go back in time, the icons will change from blue OR gates to waveforms to indicate whether the information is coming from the simulator or from previous results stored in the diagram window. The Prev and Next move the simulation time to the closest event in the diagram window. |
•The "S" top-level scope and "s" local scope buttons on the simulation button bar affect the scope of the variables in the dialog. |
|
•There are 7 different inspect tabs that let you group a set of related variables together for easier debugging. •When Simulator: Time is checked each tab will continue to update its values to the current simulation time. The Goto Current button updates a tab to the current simulation time. •The Time Line: Left click and Time Line: Cursor Move affect how the mouse changes the Time for the dialog. Left click down in the time line on the top of the diagram window, causes a value display to appear across waveforms. If these check boxes are checked then the corresponding mouse action cause the values in the dialog to change. |
Editing Signal and Variable Values in the Inspect Window
Press <F2> in the Value column of a variable in the Inspect Window to open an edit box to change the variable's value. When you press <enter> to close the edit box the value will be changed and the value will turn red to indicate the change in value.
Project Window Shows State of Signals at each Scope Level
The Project Window contains a State column which displays the current values of signals, variables, and constants during a simulation run. This feature is useful for inspecting values at a given scope level within a design when a simulation is paused. Values that have changed since the last time the simulation was paused are displayed in red to highlight activity on these signals and variables.

Viewing Array values in the Project window
The values of array variables are shown in the project window as a comma-separated list of the values of each element. It is also possible to drill down to individual elements in an array or down to individual bits in a bit vector using the project window.

Editing Signal and Variable Values in the Project Window
To change the value of a simulation signal or variable during a simulation, double click on it's value in the State column in the Project Window (or select the value cell and press <F2>), set the desired new value, then press <Enter> to close the edit box and apply the new value.
