Timing Diagram Editor 6: Advanced Modeling and Simulation |

|

|
|
Timing Diagram Editor 6: Advanced Modeling and Simulation |
|
|
Timing Diagram Editor 6: Advanced Modeling and Simulation |
|
|
|
Timing Diagram Editor 6: Advanced Modeling and Simulation |
|
|
This tutorial demonstrates how WaveFormer Pro can quickly model and simulate a digital system of moderate complexity. We will be modeling a circuit that computes histograms for 64K of data generated by a 12-bit Analog-To-Digital converter (this is a popular method for testing dynamic SNR for ADCs). This circuit is a simplified form of a real VME board that would take several months to model and simulate using conventional EDA tools. Using WaveFormer, we will model and simulate this simplified circuit in 20 minutes. The full circuit with the complete VME bus interface protocol could be modeled and debugged in about 4 hours.
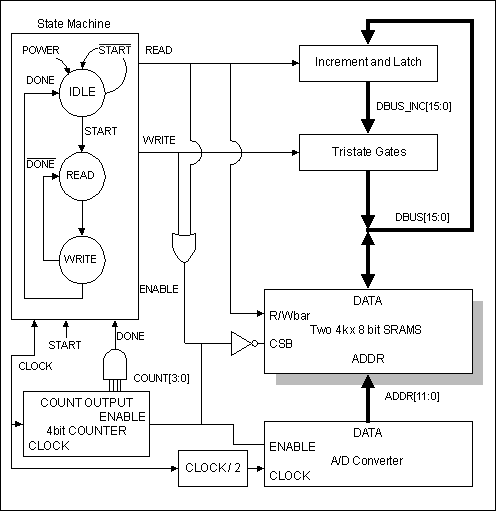
Figure 1: Histogram circuit block diagram.
This tutorial teaches the user how to:
1. Model state machines using the Boolean Equation interface.
2. Generate input signals using temporal and label equations.
3. Use the simulation log to find design entry errors.
4. Simulate incrementally by temporarily modeling outputs as drawn inputs.
5. Enter direct HDL code for simulated signals.
6. Use external HDL source code models.
7. Model tri-state gates using the conditional operator.
8. Model n-bit gates using reduction operators.
9. Model transparent latches.
10. Debug Verilog source code using $display statements.
11. Control length of simulation time using a Time Marker.
12. Edit an external HDL file with WaveFormer's Report window.
Before you begin the tutorial you may wish to view Figure 3 in Section 13 which shows a completed version of the diagram that we will generate. File tutsim.btim included in the product directory is a finished tutorial file. You will not use this file during the tutorial itself, but you can always refer back to this file if you encounter any problems during the tutorial.
Circuit Operation
A histogram is a graph displaying the count of same 12-bit values received from the ADC. To store the histogram count values we will use a 4K SRAM (2 12 storage cells) to hold a count for each possible 12-bit value that the ADC can generate. The width of the SRAM depends on how many data values we will accumulate from the ADC. In the worst case, the ADC could generate the same value for the entire histogram accumulation, so the SRAM must be able to store a value of up to 4K. Thus we will use 2 8-bit wide SRAMs (2 16 = 64K > 4K).
When the circuit starts operation, the SRAM should contain zeros at every address. Each time a data value is generated by the ADC, that data value is used as an address to look up the current count for the data value in the SRAM. The count is incremented by one and the new value is written back to the SRAM. This continues until the circuit has r