(TD) 6.2 Generate the Clock, Draw Waveforms, & Use Waveform Equations |

|

|
|
(TD) 6.2 Generate the Clock, Draw Waveforms, & Use Waveform Equations |
|
|
(TD) 6.2 Generate the Clock, Draw Waveforms, & Use Waveform Equations |
|
|
|
(TD) 6.2 Generate the Clock, Draw Waveforms, & Use Waveform Equations |
|
|
The histogram circuit has a system clock, CLK0, and three signal inputs, POWER, START and ADDR. We will create the waveforms for each of these signals using three different methods: generating from clock parameters, drawing waveforms by hand, and automatically generating waveforms from temporal equations.
2.1 Automatically generate the CLK0 system clock
Add a clock named CLK0 with a period of 100 ns:
1. Click the Add Clock button ![]() to open the Edit Clock Parameters dialog.
to open the Edit Clock Parameters dialog.
2. Verify that the default values are: name = CLK0, period = 100 ns, and duty = 50%. If not then make the necessary adjustments.
3. Press OK to accept the default values for the clock.
2.2 Graphically draw the POWER and START signal
The POWER signal is a power-on reset signal that we will use to set the initial state of our state machine. The START signal is an external input to the system that pulses high to initiate acquisition in the histogram circuit. The POWER and START waveforms are relatively simple, so we will draw them with the mouse.
1. Click on the Add Signal button ![]() twice to add two signals.
twice to add two signals.
2. Double-click on a signal name to open the Signal Properties dialog. Use this dialog to change the names of the signals to POWER and START.
3. Draw the POWER signal so that it is low for 80ns, then high for 2000ns.
4. Draw the START signal so that it is low for 60ns, high for 100ns, and then low for 800ns:
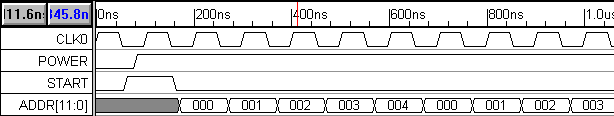
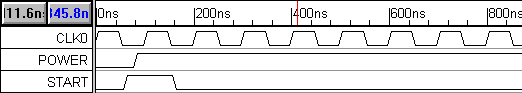
5. Verify that the timing diagram looks like:
Waveform drawing and editing techniques can be found in Chapter 1: Signals and Waveforms in the online help.
2.3 Use Temporal and Label Equations to model ADDR (A/D converter's output data)
We will model the A/D converter just as a data source, so all we need to do is generate a virtual bus signal called ADDR (the output from the ADC) that drives the address lines of the SRAMs. The ADDR waveform has a regular pattern that can be described easily using an equation, but would be tedious to draw by hand.
Add a virtual bus signal called ADDR:
1. Add a signal and change the name to ADDR. Leave the Signal Properties dialog open for the rest of the section.
2. Set the signal’s Radix to hex and the MSB to 11. Changing the MSB and Radix defines ADDR as a 12-bit signal that display its values in hexadecimal format.
![]()
The A/D converter is driven by a clock that is 1/2 the frequency of the state machine clock CLK0, so the ADDR value should change every other clock cycle (this maintains the same address for the read out of each RAM cell's count data and its write back after it is incremented). The ADDR signal should be unknown for 170ns then it should have twenty valid states, each 200ns in duration. Use the Waveform Equation interface of the Signal Properties dialog to generate the ADDR waveform:
1. Enter the following equation into the edit box next to the Wfm Eqn button: 170=X (200=V)*20
![]()
2. Press the Wfm Eqn button to apply the waveform equation. Notice that the waveform drew itself. If the waveform didn't draw, a syntax error was made when typing in the equation. To determine what the error was, look at the file waveperl.log displayed in the Report window. This file will show you which part of the equation could not be parsed. Fix the error, and press the Wfm Eqn button again.
Next, we will label the states of the ADDR bus using a Label Equation. Each state could be labeled individually using the extended state field of the HEX dialog box, but labeling twenty states would take a long time. Instead, we will write an equation to label all the states at once. Chapter 11 covers all the different state labeling functions.
1. Enter the following equation into the edit box next to the Label Eqn button Skip(1), Rep( (0,1,2,3,4), 4).
![]()
2. Press the Label Eqn button to apply the equation.
This equation will generate a hex count from 0 to 4, and then repeat it 4 times. The Skip(1) means start labeling after the first state (which we defined to be an invalid state using our waveform equation). Your timing diagram (at the appropriate zoom level) should now resemble the diagram below.