(Compare) 6: Finding the Differences |

|

|
|
(Compare) 6: Finding the Differences |
|
|
(Compare) 6: Finding the Differences |
|
|
|
(Compare) 6: Finding the Differences |
|
|
So far we have found the differences between signals by looking for the red marks on the compare signals, which is sufficient for small files. However for very large files you may want to use one of these methods for finding the differences:
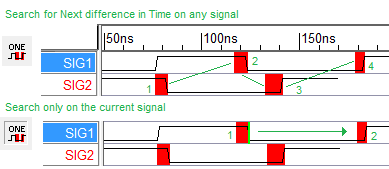
(1) Use the Compare tool bar to show the next difference:
•The Arrow buttons on the Compare toolbar are used to move between the differences in the diagram. |
|
•The One button determines how the next and previous searches are done. Normally searches find the next difference in time on any signal. If the One button is depressed, then the searches will only be done on the current signal. |
|
•Press the Move Next button a few times and watch how the selection in the diagram moves to the next difference in time. Then depress the One button and press the Move Next button a few times and notice that the searches are constrained to a single signal. |
|
•Press the Move Previous button and watch how to selection in the diagram moves to the previous difference. |
|
•Use the mouse to select an edge on a compare signal and then use the Move Next or Move Previous to jump to the next or previous difference. |
•Press the Move to First Difference and watch how it highlights the first difference found after time 0 in the diagram. |
|
(2) Hiding Signals Without Differences (matching signals)
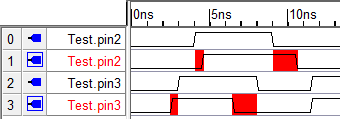
•Press the Hide button to hide signal pairs that do not have any waveform differences. |
|
•Notice that both Test.pin1 signals are no longer shown in the waveform display. |
|
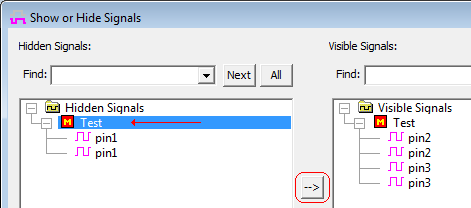
•Once signals are hidden, the View > Show and Hide Signals menu can be used to re-show the hidden signals. Select the hidden signals individually or by selecting a parent node (e.g. select the Hidden Signals to select all the hidden signals for un-hiding). Then press the arrow button to move the signals to the Visible Signals list. When you close the dialog all 6 signals should be visible. |
(3) Double click on a line in the Differences Tab of the Report Window
After a compare is performed, there will be a tab in the Report window called Differences that lists one difference per line in time order.
•Arrange the Report and Diagram window so that you can see both windows at the same time. If your Report window is not visible, select the Windows > Report Window menu option to bring the window to the foreground. •Click on the Differences tab to bring this page to the front of the Report window. |
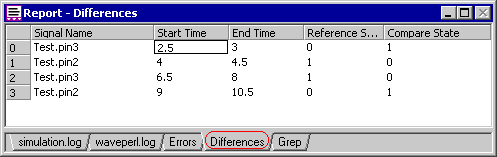
•In this example, the first difference in time is on Test.pin3. The difference started at time 2.5ns and ended at time 3ns. The Reference Signal had state value of 0 while the Compare Signal had a State of 1. •Double click a line in the Report window and notice how the corresponding difference in the diagram window is also highlighted. If this was a very large file and the difference was not displayed in the window, the diagram would have also scrolled over so that you could see the highlighted difference. |
(4) Use an external program to process the Differences File
The data displayed in the Differences tab of the Report window is loaded from a tab-delimited text file generated during the comparison. This data can be backed up and stored for later reference. The file in this example is named analyzerData_diff.txt (formed from <referenceFileName>_diff.txt). You can use the Report window to view this file by selecting the Report > Open Report Tab menu item to open the file.