(Compare) 8: Compare During Clock Cycle Windows |

|

|
|
(Compare) 8: Compare During Clock Cycle Windows |
|
|
(Compare) 8: Compare During Clock Cycle Windows |
|
|
|
(Compare) 8: Compare During Clock Cycle Windows |
|
|
The clocked comparison described in the previous step provides for comparison in state of signals around clock edges, but sometimes you need to check for signal differences during a window of time that is relative to the clock cycle, but not around the clock edge itself. You can use a second clock, offset from the first, to create windows during which to compare during the high or low segments of the original clock instead.
Add Offset Clock to Diagram
Since the window comparisons in this example are to be relative to the original clock, the offset clock will have the same frequency and period as the original clock, but have a different starting offset value.
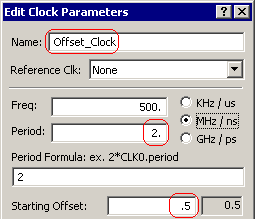
•Add a second clock to the diagram and set the following in the Edit Clock Properties dialog. •Set the Name to Offset_Clock, the Period to 2ns, and the Starting Offset to .5. •Press OK to close the Edit Clock Properties dialog and apply the changes. •Notice the Offset_Clock now starts halfway through the first segment of CLK0. |
|
Change the Compare Signals to Use the Offset Clock
Next, change the three Compare signals to use the Offset_Clock as the clocking signal and use the Tolerance settings to create the window for comparison:
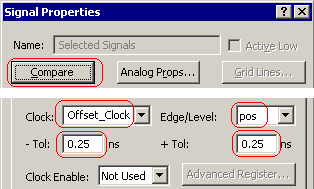
•Either press the SET ALL button or choose the View > Compare and Merge > Edit Compare Signals menu to select all the compare signals and open the Signal Properties dialog. |
|
•Set the Clock to Offset_Clock and the Edge/Level to pos. •Set both Tolerance values to 0.25 to create the testing window. •Press the Compare button to apply the changes and perform the comparison. |
|
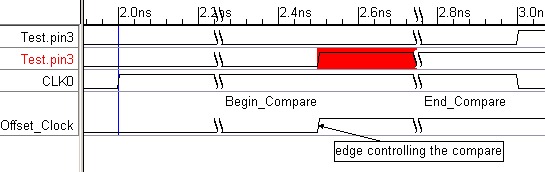
•Below is an image that we made by first zooming into the diagram. Then we placed two markers around the sampling clock edge at exactly -.25 ns and +.25 ns around the edge to show the sampling region created by the Tolerance setting. We also used a text object attached to the clock edge to call attention to it. •Notice that the difference between the two Test.pin3 signals continues beyond the compare window. |