(Sim) 1.8 Breakpoints, Stepping and Inspecting |

|

|
|
(Sim) 1.8 Breakpoints, Stepping and Inspecting |

|

|
In this section we will place a breakpoint in the generated code and take a brief look at the debugging environment.
Insert a code breakpoint and simulate
•Double click on the syncad_top module in the project tree to open an editor that displays the generated code. |
|
•Scroll down to the task Unclocked module, to see the stimulus code that was generated from the drawn waveforms. •Place a breakpoint on the first change of the y_driver signal by left clicking on the grey bar on the side of the editor window. This will place a red dot in the margin. |
|
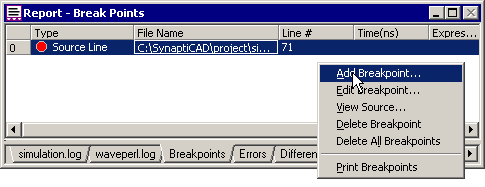
•Also note that the Report window breakpoints tab lists the source line break point. BugHunter also supports time and condition breakpoints that are covered in Chapter 3 Debugging of the BugHunter and VeriLogger manual. These other kinds of breakpoints can be added by right clicking on the breakpoint tab window and choosing Add Breakpoint from the context menu, but the easiest way to add a condition breakpoint on a signal is to right click on it in the project tree and select the Add/Toggle Condition Break Point... menu option. This will cause the simulation to stop whenever the signal changes value. |
|

•Press the large green Run button to simulate to the breakpoint.This particular code line will execute twice at time 50 because it is a non-blocking statement. The expression values of Non-blocking statements are evaluated when the statements are first encountered, but they only update their assigned signal at the end of the simulation cycle (as opposed to blocking statements which evaluate and immediately update the assigned signal). |
|
•Add a breakpoint to the first exclusive or in the add4.v file, then restart the simulation. •Press the run button a few times and watch the green status bar at the bottom. The fulladder model is instantiated 4 times inside the FourBitAdder module, so you are going to hit this breakpoint a lot. The status bar shows which instance is executing. Here, the fa1 instance of fulladder, which is instantiated in module FourBitAdder is about to execute. |
|
Single step through the code
•Next press one of the single step buttons a couple of times to watch the execution of the code. Notice that step with trace (the middle button) leaves a trail of statements in the simulation log tab of the Report window. Make sure to check the status bar and compare the execution to the schematic in section 1.2. |
|
Use the Inspect Values
•Put the cursor over a variable that has been initialized to see its current value. |
|
•Variables that are watched in the Stimulus and Results diagram can be inspected for values at previous times. See the instructions in the BugHunter and VeriLogger manual for using the Simulate > Inspect Variables menu function (to fill the window, drag signal names from the Stimulus and Results diagram or type them in manually). |