1.5 Measuring Time and State values |

|

|
|
1.5 Measuring Time and State values |
|
|
1.5 Measuring Time and State values |
|
|
|
1.5 Measuring Time and State values |
|
|
There are several different ways to measure and display times and state values.
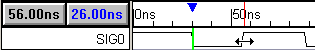
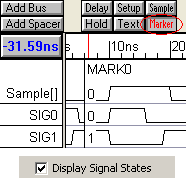
Time and Delta Buttons
•The Time Button, with the black writing, displays the current position of the mouse cursor in the Diagram window. The Delta Button, with the blue writing, displays the difference between the mouse cursor and the delta mark (an upside-down, blue triangle) on the timeline above the Diagram window. |
•To measure, left click on an edge (to select it and also move the delta mark), then move the mouse over another edge. The Delta button will display the difference between the mouse position and the blue mark. |
|
•To turn off the continuous measurement in the buttons, choose the Options > General Preferences menu to open a dialog and then uncheck the Continuous Measurement box. •Continuous Measurement: If checked, then the black and blue digital readouts continuously update as the mouse cursor moves. Uncheck this box if the flicker bothers you. Default is checked. |
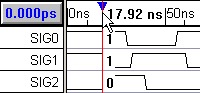
Display Signal States by clicking in the time line
•Click in the timeline in the Diagram window to drop a temporary marker line that displays the numerical state of each signal. |
|
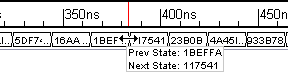
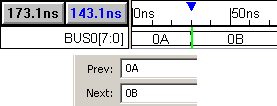
Display Signal States by hovering over a state transition or bus segment
•The mouse tool-tip displays the next and previous states of bus segments when the bus hovers over a state transition. This feature can be disabled by unchecking the View > Show State at Cursor menu. |
|
•Bus states automatically show partial extended state data when the segment is too small to show entire state in diagram window. |
|
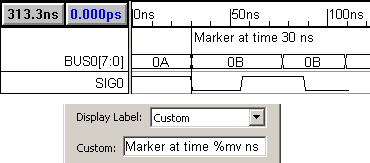
Display Signal States using Markers
•Select the Marker button and right click in the timing diagram to add a Marker. Hovering over a marker will show the state values of the signals at that time. To disable this feature, uncheck the Popup Display Signal States for Markers checkbox option in the Drawing Preferences dialog. •To permanently display the state values beside a marker, double click on the marker and check the Display Signal States checkbox in the Marker Properties dialog. |
|
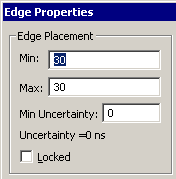
Using the Edge Properties Dialog to Measure Times and States
•Double click on the edge to open the Edge Properties dialog which displays the min and max times and uncertainty. Entering a new time moves the edge. •The min uncertainty edit box lets you add a minimum uncertainty region to an edge. If no delays cause an uncertainty greater than the transition's minimum uncertainty, the transition will be given its minimum uncertainty value. •The Uncertainty = Xns displays the actual width of the uncertainty region. |
|
•If checked, the Locked checkbox fixes a transition at a specific time. This also indirectly locks any transitions connected to the locked transition by a defined timing path. Clock transitions are always locked. |
•The Prev and Next boxes display the states on the buses. This is particularly useful when the states are very close together. |
|
•The Prev and Next buttons moves the dialog to the previous or next edge on the signal. |
|
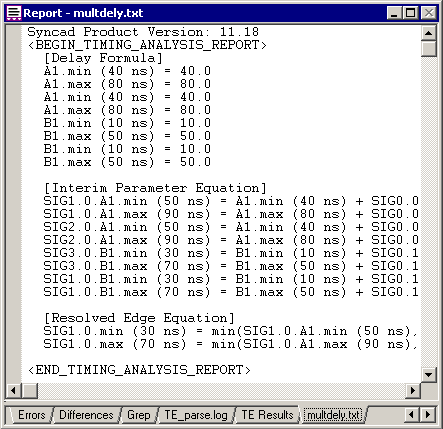
Generate a Timing Analysis Report
To figure out how the time for a particular edge is calculated, you can generate a Timing Analysis Report.
•Choose File > Save Timing Diagram As and select Timing Analysis Report from the Save As Type box. •When the file is saved, it will also be opened in a tab in the Report window. If you cannot see the Report window, choose the Window > Report. |
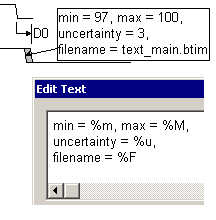
Display time using Text objects, Parameters, or Markers
•Use a Text Object with control codes to display edge times: press the Text button, select the edge, then right-click to open an edit box. Enter %m, %M, or %u control codes to display min transition, max transition, or uncertainty region (Section 6.1: Adding Text). |
|
•Display the distance between two transitions: Add a setup or hold parameter between the two transitions. Double-click on the parameter to open the Parameter Properties dialog, and choose the Distance from the Display label drop-down, and optionally check the Outward arrows box (Section 5.3 Display Settings for Parameters). |
|
•Display the exact placement of a time marker: Press the Marker button the right-click in the diagram to add a time marker line. Double-click on the marker line to open the Edit Time Marker dialog and change the Display label to min value or custom using the %mv control code (Section 6.4 Markers Lines). |