(Sim) 1.6 Draw Test Bench in Debug Run Mode |

|

|
|
(Sim) 1.6 Draw Test Bench in Debug Run Mode |
|
|
(Sim) 1.6 Draw Test Bench in Debug Run Mode |
|
|
|
(Sim) 1.6 Draw Test Bench in Debug Run Mode |
|
|
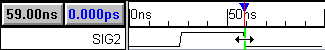
Draw the test bench on the input ports of the of the MUT. You can draw anything and see the results, however the result images shown in this tutorial will be using the timing diagram shown below.
Draw the Test Bench
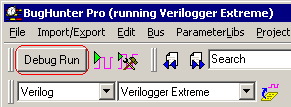
•Make sure the simulation mode is set to Debug Run, rather than Auto Run, so that the simulator does not re-simulate while you are drawing. |
|
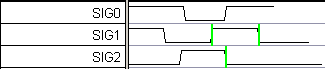
•Draw the following waveforms on the input ports of the MUT (see below for drawing instructions if you need them). Notice that the waveforms are black to indicate that will drive the MUT. If you have never used SynaptiCAD's drawing environment, then read the rest of the instructions in this section and practice drawing random signals before drawing the following diagram: |
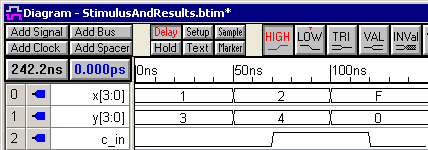
•Notice also that if you draw on the output ports (sum or c_out) the waveforms would be blue to indicated that they are expected outputs from the MUT. This expected output is used by the Reactive Test Bench Option to create self-checking test benches, which is covered in the Reactive Test Bench Option Tutorial. For this tutorial, you can delete the sum and c_out signals because we will not use them in this tutorial. |
Basic Drawing Instructions (Skip to Section 1.7 if you can draw the timing diagram)
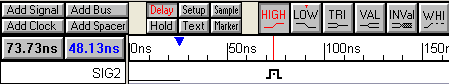
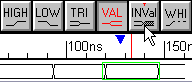
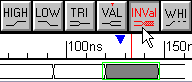
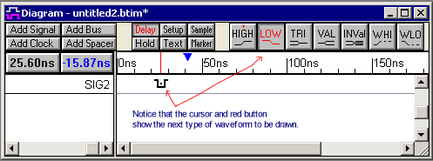
The timing diagram editor is always in drawing mode, so left clicking on a signal will draw a waveform. The red state button controls the type of waveform that is drawn (high, low, tri-state, valid, invalid, weak high, and weak low). The buttons toggle back and forth between two states, and the next state is indicated by the little red T on top. Click on the state buttons to set the toggle and next state.
![]()
To draw the waveform of a signal:
•Place the mouse cursor inside the Diagram window at the same vertical row as the signal name.The red state button on the button bar determines the type of waveform drawn. The cursor shape also mirrors the red state button
•Click the left mouse button. This draws a waveform from the end of the signal to the mouse cursor. |
|
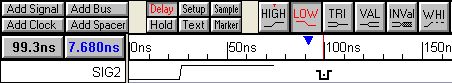
•Move the mouse to the right and click again to draw another segment. |
|
•Keep drawing from left to right across the diagram. |
|
•Pressing the middle mouse button either toggles the state buttons or cycles through them depending on the setting in the Design Preferences dialog. Choose Options > Design Preferences menu to open the dialog. |
There are several mouse-based editing techniques used to modify existing waveforms. These techniques will only work on signals that are drawn. They will not work on generated signals like clocks and simulated (purple) signals.
1) Drag-and-Drop a Signal Transitions:
•To move one transition, click on the transition and drag it to the desired location. |
|
•To move all of the transitions on one signal, hold down the <1> and <2> number keys while dragging. Holding down just the <1> key moves all the edges to the left, and the <2> key moves all the right. |
|
•To move transitions on different signals, first select the transitions by holding the <CTRL> while clicking on them. Then drag the transition to desired location. |
|
2) Click-and-Drag to insert a segment into a waveform:
•Inside of a segment, click and drag the cursor to insert a segment |
|
•The inserted state is determined by the red state button |
|
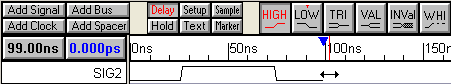
3) Change a segment's graphical state by selecting it and then pressing a state button:
•Click in the middle of the segment to select it (so that it has a green box around it). |
|
•Click on a state button to apply that graphical state to the segment. If you change a segment to same level as an adjacent section, the transition will turn red to preserve the edge data. This transition can be deleted if necessary. |
|
4) Adding virtual state Information to a segment
•For Signals, double-click on the middle of a segment to open the Edit Bus State dialog, and then type in a new value into the Virtual edit box. |
|
•For Clocks, press the Hex button and then double-click on the middle of the segment to open the Edit Bust State dialog. If the Hex button is not pressed, the double-click will open a different dialog to allow editing of the clock.