(TD) 1.12 Drawing with Equations |

|

|
|
(TD) 1.12 Drawing with Equations |
|
|
(TD) 1.12 Drawing with Equations |
|
|
|
(TD) 1.12 Drawing with Equations |
|
|
We have finished with the timing analysis section of this tutorial, and next we would like to take the time to show you a few more drawing techniques that will help you create and manage complex timing diagrams. One such technique is to use equations to draw and label waveforms. Waveform and label equations provide a quick way to generate signals that have a known pattern that is more complicated than a periodic clock. WaveFormer (and higher editors) also support simulated signals based on Boolean Equations which are covered in the Simulated Signal tutorial.
Use the Waveform Equation Feature:
The waveform equation box in the Signal Properties dialog accepts a list of time/value pairs, and the default equation has all of the syntax and states that are supported by this box. Each time you press the button more waveforms will be added on to the end of the signal.
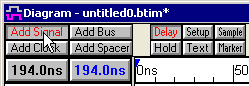
•Press the Add Signal button two times to add two new signals to the diagram window. •Double click on SIG0 to open the Signal Properties dialog. |
|
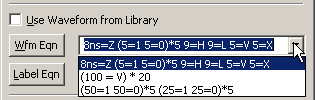
• Press the Wfm Eqn button to apply the default equation to SIG0. This equation shows the syntax for all possible waveform types. Look at the waveform and try to match it to the different parts of the equation. |
|
•The first pair, 8ns=Z, causes an 8ns long tri-state segment to be drawn. |
|
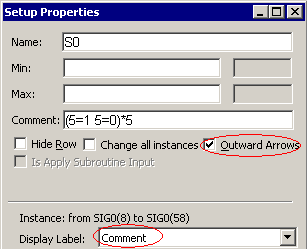
•The next terms, 5=1 5=0, draws a 5 ns long high segment followed by a 5ns low segment, where the ns is implied by the display time unit. Enclosing it in (...)*5 causes the sequence to be repeated 5 times. •The other pairs are interpreted in a similar manner. The values H and L draw weak high and low waveforms, and V and X draw valid and invalid sections. •We annotated the last sequence using a setup parameter and changing the display label from name to comment. |
|
Use the Label Eqn Feature:
Label equations are used to automatically insert data on waveform segments. All of the equations are listed in the label fly-out box. Here we will draw and label a counter signal that first counts up and then counts down.
•Double click on SIG1 to open the Signals Properties dialog, then use a waveform equation to draw seven valid segments that are 10ns long. |
|
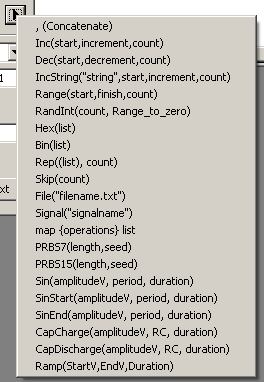
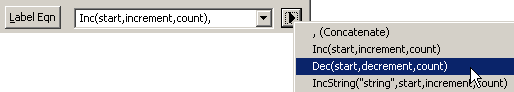
•Open the fly-out to the right of the Label Eqn button and take a look at the list of available functions. Choosing any function puts it at the end of the current label equation, then you can edit the parameters of the function call. •Functions can be concatenated together by separating them with a comma. •The Analog Label equations for sine waves, capacitor functions, and ramps are covered in the Analog Signals Tutorial. |
|
•Use the Label equation quick-fill box and choose Inc then Concatenate and then Dec to add those equations to the edit box. |
•Edit the parameters as shown, so that the counter first starts from 0, adds 1 each time, and counts up for 4 cycles. Then make the counter count down starting at 2, for 3 cycles. |
|
•Press the Label Eqn button to apply the equation. |
|