Chapter 3: Waveforms and Test Bench Generation |

|

|
|
Chapter 3: Waveforms and Test Bench Generation |
|
|
Chapter 3: Waveforms and Test Bench Generation |
|
|
|
Chapter 3: Waveforms and Test Bench Generation |
|
|
BugHunter uses the current Stimulus and Results diagram to to graphically generate stimulus vectors for the simulation and to display the simulation watch signals that capture simulation waveform data. The Stimulus and Results diagrams can be archived to separate directories and used for regression testing. If your top-level component has input ports, BugHunter can take the drawn waveforms in the stimulus and results file and create a stimulus component and a wrapper component that hooks the stimulus up to the model under test. This makes it very fast to test individual models and small designs.
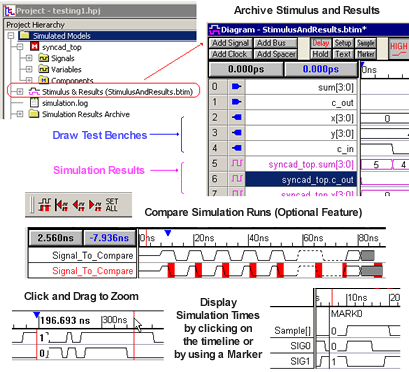
If you have purchased the Waveform Comparison Option for BugHunter, then you can perform automated comparisons between different Stimulus and Results diagrams. Also, if you have purchased the Reactive Test Bench Generation option, you can create test benches that check the simulation output and create pass/fail logs.
If your simulations are big enough to start slowing down because of the memory limitations of your system, there are several methods for reducing the memory requirements for a simulation. The first method is to dump the waveform data to a BTIM or VCD waveform file and turn off the graphical display of waveform data during simulation. After the simulation completes, you can load in the waveform file and view it graphically. Also, you can eliminate the overhead from the graphical debugger by running Verilog simulations from the command line as described in Chapter 5: VeriLogger Command Line Tools.