4.9 Editor Window Overview |

|

|
|
4.9 Editor Window Overview |
|
|
4.9 Editor Window Overview |
|
|
|
4.9 Editor Window Overview |
|
|
This is an overview of the Editor Window features and links to the associated help.
Debugging during Simulation
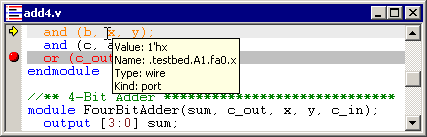
•Add source line breakpoints by clicking to add red dots in the left column of the editor ( 2.4 Breakpoints ) •View and edit signal state values by hovering with the mouse ( 2.5 Inspect And Edit Values ) |
•Go from the Editor to the object in the Project window by right clicking and choosing Find in Project. From the project window, you can analyze the drivers for this object. ( 2.6 Find Drivers ) •Managing editor windows during single stepping with editor Tabs and drag and drop windows ( 4.1 Opening, Saving, and Creating New Source Code ) |
Normal Editing Functions
•Open, Save, and Create new text files ( 4.1 Opening, Saving, and Creating New Source Code ) •Search in an editor window ( 4.2 Navigating Code with Buttons and Report Tabs ) •Text Slide In and Out to quickly add or remove comments and strings to selected lines ( 4.4 Fast HDL Code Editing ) •Many editor functions like Find, Jump To, and Breakpoints are available as right click menu ( 4.4 Fast HDL Code Editing ) •Keystroke commands for editor windows ( 4.6 Editor and Report Window Commands ) |
Setting up and controlling Editor Windows
•Editor Preferences ( 4.7 The Editor/Report Preferences Dialog ) •Using XEmacs as a replacement editor ( 4.8 XEmacs Integration and other External Editors ) |