Step 7: Simulate and Debug - General Overview |

|

|
|
Step 7: Simulate and Debug - General Overview |
|
|
Step 7: Simulate and Debug - General Overview |
|
|
|
Step 7: Simulate and Debug - General Overview |
|
|
BugHunter can perform a variety of graphical debugging functions which are covered in detail in Chapter 2: Simulate and Debugging Functions. Basically, you will start the simulator and view the results either in the Stimulus and Results diagram or in one of the tabs of the Report window.
Start the Simulator:
•Start the simulator by pressing one of the green buttons on the Build and Simulate button bar. Section 2.2 Build and Simulate explains the differences between the types of single stepping and running. |
![]()
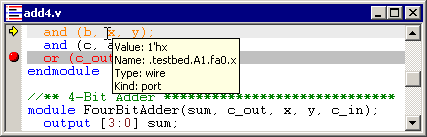
•When single stepping, the yellow arrow button will open the editor with the line of code that will be simulated next, and the line of code is marked with a yellow arrow as shown below. •Variables can be inspected by moving the mouse cursor over the variable in the editor window (see Section 2.5: Inspect values for more inspection features). •The red dots in the margin of the editor window are breakpoints (see Section 2.4: Breakpoints for more advanced breakpoint types). |
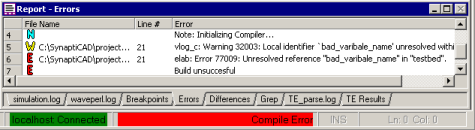
Check for Errors:
•The status bar in the lower right hand corner displays a red message if an error is found during the build or simulation. •In the Errors tab of the Report window, double click on an error to open an editor window that will display the code the caused the error. If you cannot see the Report window, select Window > Report menu to bring the window to the front. |
•The Simulation Log tab also displays error messages and other messages that are produced by the simulator, however these are not linked to the code. •The Waveperl Log tab will display error messages that are associated with test bench code generation. Usually, only TestBencher Pro and Reactive Test Bench users need to check this tab. |
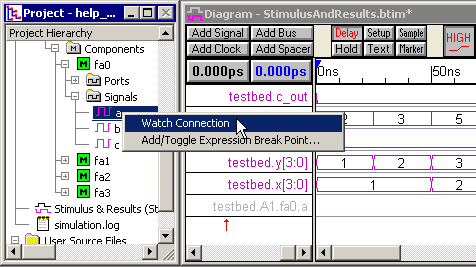
View Waveform Simulation Results:
The signals in the top-level module will automatically be put into the Stimulus and Results diagram and waveforms will be displayed as the simulation progresses. Signals can be added to the diagram by right clicking on the desired signal in the Project window and setting a watch on it. Signals can be removed by deleting them from the Stimulus and Results diagram. See Chapter 3 for information on using multiple Stimulus and Results diagrams.