|
|||||||||||||||||||||||||||||||||||||||||||||||||||||||||||||||||||||||||||||||||||||||||||||||||||||
|
|
|
Using Grid LinesTime markers and grid lines offer two methods to add vertical lines in SynaptiCAD products. Time markers and grid lines both draw verticle lines, but they have different uses and features. Grid lines are lines drawn on transition edges of signals or clocks, and stay locked to each edge they are drawn on. The color, style, size, and frequency of grid lines can be defined by the user. To add grid lines on a signal or clock, press the Grid Lines button in the Signal Properties dialog. This will open the Grid Options dialog. 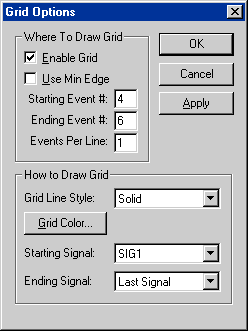
The Grid Options dialog: The Starting Event # is the first signal edge where a grid line is drawn. The Ending Event # is the last signal edge where a grid line is drawn. If it is left blank, grid lines are drawn up to the last edge, and added to all new edges. The Events Per Line determines the number of signal edges with a corresponding grid line. A value of 1 means that a grid line is drawn on every edge (from the starting event to the ending event), a value of 2 means that a grid line is drawn on every second edge, and so on. The Starting Signal is the first signal to display grid lines. The Ending Signal is the last consectutive signal to display grid lines. 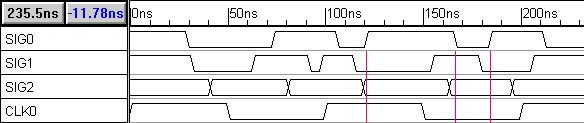
This timing diagram shows the results of the above grid options applied to SIG0. Note that the grid lines correspond to the 4th, 5th and 6th signal edges of SIG0. Also note that because the Starting Signal is set to SIG1, the grid lines are only drawn on SIG1, SIG2, and CLK0. When you hide a signal with corresponding grid lines, the grid lines are still displayed. This is a great way to visually separate sections of a timing diagram. |
|
|