The Verilog Simulator that provides the best debugging possible.
Get a High-performance compiled-code Verilog 2001 simulator with a
FREE 6-month License
Accuracy and time is essential—especially when it comes to your development simulation and debugging.
Our Verilog simulator and compiler will change the way you can simulate, debug, and manage
your development process.
VeriLogger Extreme is a high-performance compiled-code Verilog 2001 simulator with automatic test bench
generation that significantly reduces simulation debug time. VeriLogger Extreme offers fast simulation of
both RTL and gate-level simulations with SDF timing information. VeriLogger Extreme supports design
libraries and design flows for all major ASIC and FPGA vendors, including Actel/MicroSemi, Altera, Atmel, LSI Logic,
QuickLogic, and Xilinx.
BugHunter Pro - Graphical Debugger Included
Ready to take your design and debug to the next level? BugHunter Pro is our graphical Verilog/VHDL
integrated development environment. With BugHunter Pro you can track down errors by following signal
changes through the source code. The timing diagram environment is optimized for high-speed waveform dumping
and viewing. Also all the graphical features of the timing diagram software can be used to generate
Verilog test bench code. BugHunter supports all major VHDL/Verilog simulators.
Easy Simulation and Hardware Testing
We go one step ahead of the competition by allowing engineers to re-use test vectors created in the
simulation phase during the hardware test and debug. This results in time saved, because the same
tests used to test your simulation models can test your actual hardware. In the
opposite direction, Verilogger's timing diagram environment can take data acquired with a logic analyzer
and generate a Verilog test bench, enabling you to test how your simulation reacts to data from existing hardware.
Technical Details
Read more about the technical details here:
Evaluate and Purchase VeriLogger:
VeriLogger Screen Shot
Take a look at everything available to you in the VeriLogger Program:
Simulation Button Bar
The simulation bar allows you to control the simulation mode, run/resume your simulations,
restart a project, change the interactive scope for console commands, or expand to local scope.
- Simulation Mode switches between normal debug/run mode,
and a unique auto-run that restarts the simulation after graphical changes to the waveform.
- Run/Resume continues the simulation from the current time.
- Single Step and Step Into trace calls continues the simulation for one line of code.
- Restart stops the current simulation, and restarts at time zero.
- Scoping Buttons changes scope for console level commands.
- Goto Button opens an editor at the last line of code executed.
- Stop stops a Verilog simulation.
- Build runs the Verilog compiler and creates the Verilog tree, but does not start a simulation.
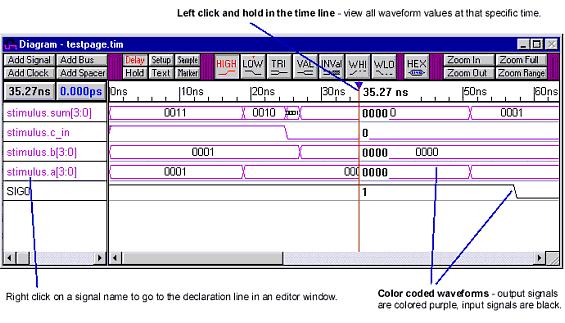
Diagram Window
Color coded waveforms help you distinguish between graphical test bench waveforms and
simulated result waveforms. Left clicking in the time line, displays a marker showing the exact waveform
value at a particular time. Right clicking on a signal name will take you to where the signal is declared in the
Verilog source code.

Report Window
The Report window manages your different log files, breakpoints, error files, and source code files
for the Verilog simulator project. Each tab can also be opened in a different window if code needs to be viewed side-by-side.
Project window
Whether you are working on a single project, or many at a time, with the project window, you will
be able to easily manage and keep track of as many Verilog files as you need. Once the Project is built
by the Verilog compiler, the Project will display a tree of the design.
Editor window
The editor window offers extremely useful features to ensure that you get the most
out of your Verilog simulation and debug experience. You have the ability to watch multiple signals,
ports, or components. You can also hover over variable names to see their value,
and move quickly between the tree and the editors to locate definitions.
Status Bar
The status bar on the VeriLogger is easy to access, and will ensure that you always know what state your Verilog simulation is in.
Customer Feedback
Don't just take our word for it! Our customers LOVE our product. Take a look at what they say:
VeriLogger Questions
Have any questions? Contact us at 540-953-3390 to learn more about the VeriLogger.
Visit here for a quick primer on
Verilog syntax. We also maintain a blog with updates about tips and features of
Verilog simulation with VeriLogger.
Competitive Pricing
With so many different features, we offer competitive pricing of our Timing Diagram and Verilog Simulation products.
Interested in what our tools can do for you or your team? Contact us today!
Language translations
Japanese translation: Verilog simulator
German translation: Verilog simulator
French translation: Verilog simulator
|