VeriLogger Feature List
Two Simulators to choose from:
- VeriLogger Extreme is a high-performance
compiled-code Verilog 2001 simulator that offers fast simulation of both RTL and gate-level simulations
with SDF timing information.
- VeriLogger Pro is an interpreted Verilog-95
compliant simulator with a low memory footprint. It is an excellent simulator for RTL level and small
FPGA designs, but does not support strengths.
Simulation Features
- Two simulators in one! - As your project nears completion, you may want
to trade ease-of-use for faster simulation times. For this reason VeriLogger ships with two simulators:
the graphical simulator and the command line simulator. The command line simulator is streamlined for
speed and simulates about twice as fast as the graphical simulator. To run the command line simulator
open a command line window on your operating system. Windows users should open a DOS prompt.
- Auto Run Mode for unit level testing - In Auto Run
mode the simulator will automatically run a simulation each time a waveform is drawn or changed in the
Waveform window. This mode makes it easy to quickly test small modules and do bottom-up testing.
- Interactive command console is used to enter Verilog commands to observe,
control, and debug the simulation. The interactive command console is the drop-down edit box located
on the simulation button bar. During a simulation you can enter a Verilog command such as $finish;
(to control the simulation) or $display; (to display the value of a variable).
Display Features
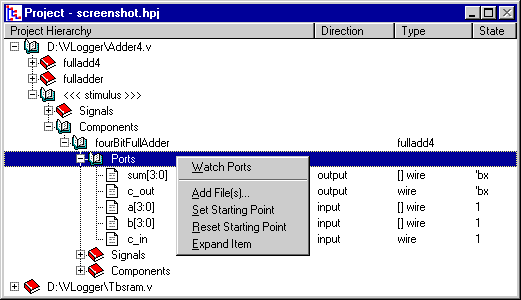
- Project Tree control - The Project Tree control is used to investigate
the hierarchical structure of the Verilog components, view source code, and set watches on signals.
Each node in the tree has a context sensitive pop-up menu that can be opened by right clicking on the
node.
- Interactive image of VeriLogger Extreme simulation environment.
Debugging Features
The Report window is a great place to start the debug process. It manages several tab windows, three
of which are important to simulation and debugging.

- The verilog.log tab contains the default log file for VeriLogger. All
information generated by the simulator, such as compiler messages, and all user-generated messages from
$display tasks and traces are sent to this file. During a simulation run you should watch the verilog.log
file for important messages. Click on the verilog.log tab to view this file.
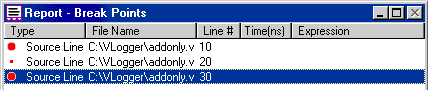
- The Breakpoints tab lists the breakpoints in the current project.
To add a breakpoint:
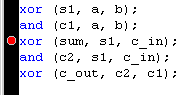
- In an editor window, left click on the black line on the left side of the window. This
adds a breakpoint, indicated by the red circle on the line. It also adds a breakpoint listing to the
Breakpoints tab in the Report window.
- OR, right click anywhere in the Breakpoints tab window and select the Add Breakpoint
option from the pop-up menu.
The breakpoint tab window supports several mouse-oriented features:
- Double clicking on a breakpoint will open an editor starting at that line in the code.
- Right clicking anywhere in the tab window will open a menu allowing you to add, edit,
or delete breakpoints.
- Left clicking on a red breakpoint button will toggle it between active and inactive states.
An inactive breakpoint is displayed as a small red circle and is ignored in a simulation.
- The Errors tab displays compile errors. If the compiler discovers an
error, a message is returned to the verilog.log tab and the Errors tab. The verilog.log tab displays
all simulation information and finding a specific error can be difficult. Using the Errors tab enables
you to quickly view all simulation errors. Double clicking on an error in the Errors tab will open an
editor starting at the line of source code where the error was found.
Waveform Import/Export Features
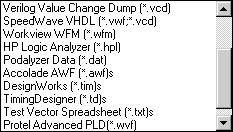
- In addition to importing the standard VCD files, VeriLogger Extreme can also import waveform
data in a variety of formats. See the drop down box on the right for a list of supported formats. Note
that VeriLogger can view and simulate data from HP Logic Analyzers.
- VeriLogger can do more than just simulate
- verilog files and export the standard VCD waveforms. VeriLogger Extreme can generate
stimulus for many different formats including: VHDL, Verilog, ABEL, STIL, HP Pattern Generators, TDML,
and SPICE.
WaveForm Drawing and Editing Features
- Graphical stimulus generation - Automatically generate verilog code
from your timing diagrams. Click here to see
an example.
- VeriLogger Extreme contains all the drawing, editing and documentation features contained
in WaveFormer Pro. Click here
to see the complete feature list.
VeriLogger Extreme page
|