|
|||||||||||||||||||||||||||||||||||||||||||||||||||||||||||||||||||||||||||||||||||||||||||||||||||||||||
|
|
Waveform Generation and Bus Tutorial (Tutorial 2B)In this tutorial you will learn techniques to quickly generate signals from temporal equations, add equations to existing signals, and create Virtual, Group and Simulated buses. For additional information through this tutorial, please refer to the manual, or the on-line help. This tutorial assumes that you are able to draw signals and are familiar with the features explained in the previous tutorials. We recommend that beginners start with the Basic Drawing and Timing Analysis Tutorial, tutbas1.htm, to learn the basics of timing diagram editing, before attempting this tutorial.
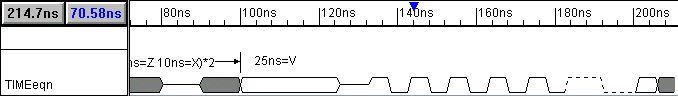
Figure 1:1 Timing diagram used for this tutorial. Demonstrates buses, virtual buses, and signal generation using temporal equations.
1) Generate Waveforms From Temporal EquationsGenerating waveforms from temporal equations provides a quick way to generate signals that have a known pattern that is more complicated than a periodic clock. Temporal equations are entered in the Signal Properties dialog using the edit box to the right of the Wfm Eqn button The edit box contains the default equation: 8ns=Z (5=1 5=0)*5 9=H 9=L 5=V 5=X The default equation draws a waveform that uses all of the available waveform states. If you start by editing the default equation you do not have to memorize the syntax of these equations. The syntax consists of time-value pairs separated by spaces. The values are 0, 1, Z, V, H, L, and X which represent the graphical states of the waveforms. For example, the 8ns=Z part of the default equation draws an 8 ns tristate segment. To repeat a sequence of states, enclose a list of time-value pairs in parentheses and use the multiply symbol * followed by the number of times the list is to be repeated. For example (5=1 5=0)*5, draws five copies of a 5ns strong high segment followed by a 5ns strong low segment. To experiment with temporal equations:
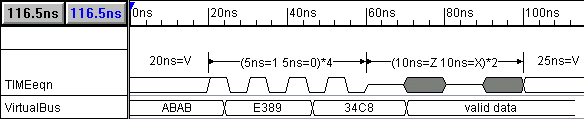
The 20ns=V in the equation means that the signal will be initially valid for 20ns. Next the (5ns=1 5ns=0) will cause the signal to be a strong high for 5ns then a strong low for another 5ns. The *4 will cause the sequence inside the parentheses to be repeated 4 times. The rest of the equation is interpreted in the same way.
The text in the diagram above is made with a combination of text objects and setup parameters with custom labels. It is used to illustrate the different components of a temporal equation. This is just a quick demonstration of the documentation abilities of the program. For more information on documentation read Chapter 8: Formatting Timing Diagrams. You do not have to add the text for this tutorial.
Waveform equations are stored in the waveform equation drop down box, located next
to the Wfm Eqn button.
Adding equations to existing signals:
Temporal Equations and a related feature called State Label Equations provide a quick method of generating and then labeling signals that represent Counter and Shifter circuits. The on-line help Chapter 11: Waveform Equation Generation has more information on these features. 2) Virtual, Group, and Simulated BusesThere are three kinds of buses supported by the timing diagram editor: group buses, virtual buses, and simulated buses.
2.1 Creating Virtual Buses: Virtual Buses are the recommended way to display and work with bus information. Virtual Buses are also supported by the VHDL and Verilog stimulus and test bench generation features. If timing parameters are attached to a bus then virtual buses will increase computational performance for timing diagrams that use large buses (32 bits or more). To create a virtual bus:
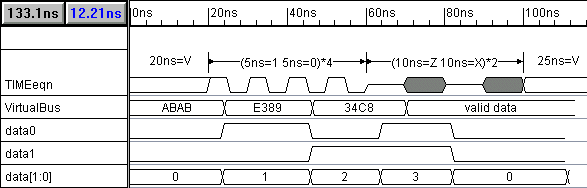
When exporting to VHDL or Verilog, the Virtual State information contained in a valid supersedes the graphical state of a segment. This allows you to export the state values of signals with types that have no graphical representation (integers for example). 2.2 Creating Group Buses: Use group buses only when you need to get access to an individual bus signal at some point in your design or if you need to compress several signals that already exist. Group buses are useful for analysis of data that is imported from simulators or test equipment. Before a group bus can be created, its member signals must either be specified by selecting the signal names or new signals need to be created. We will use both methods in this tutorial. To create a group bus and its member signals:
Creating a group bus from existing signals Select the signal names to be grouped, in order from LSB to MSB, then click the Add Bus button. In the next example we will create a second group bus whose member signals are reversed from the data bus.
Group buses have many features that are covered in Chapter 3: Group, Simulated, and Virtual Buses of the manual and the on-line help. Before you use group buses extensively, you should read this chapter and play with the align, bind, and expand features. 2.3 Creating Simulated Buses Simulated Buses are similar to Group Buses. The primary difference is that the bus is generated using a Boolean Equation. A simulated bus can be referenced in another signal's Boolean equation, (group buses cannot). Also, TestBencher will generate a Boolean equation for the timing transaction so that the simulated bus can include input signals as member signals. To add a Simulated Bus:
3) SummaryCongratulations! You have completed the Waveform Generation and Bus tutorial. In this tutorial we covered the generation of Waveforms from Temporal equations and adding to existing signals. We also covered virtual buses, group buses, and creating a group bus from existing signals. We examined the differences between Virtual, Group, and Simulated buses, and the recommended use for each. For more information, please refer to the manual or the on-line help.
|
||||||
|
|